GOOD MORNING,
Topping formations and slightly improved forecasts for next week shook the weaker corn bull out this week on a healthy dose of housecleaning activity. Topping formation charts and scattered rainfall over the Midwest created long liquidation in grains, while beans found a bit of short-covering at the lows. Beans, corn, and wheat are 35c off the highs posted Sunday night.
WEATHER
Hot this week but scattered rainfall continues to play out across the Midwest with showers due in across the Midwest over the weekend. Hot temperatures are due to break next week. The 6 to 10 day outlook calls for variable temperatures and rainfall near to below normal.
STORIES
Reports of slowing ethanol production add to the downside for corn. Negative margins of -30 to -50c/bu suggests that some plants should be slowing. Margins are weaker due to higher Midwest corn prices as well as oversupply from continued trade tensions with China.
Two Iranian vessels are stuck in Brazilian ports as they cannot get fuel from the state run oil firm of Petrobas due to US sanctions.
ANNOUNCEMENTS
The Rosario Exchange reduced its estimate of Argentine wheat crop by 500 tmt down to 21.5 mmt with the crop 90% planted.
Chinese state media said the country's agriculture ministry has declared African Swine Fever outbreaks as contained. The ministry noted that there were 48 cases reported so far this year, with the monthly average declining sharply.
Russia's IKAR reduced their 2019 grain harvest forecast by -2.0 mmt to 121.4 mmt vs. an early July estimate at 123.4 mmt.
Calls are as follows:
beans: 8-10 higher
meal: 2.20-2.50 higher
soyoil: 10-20 higher
corn: 2 1/2-3 higher
wheat: 2 1/2-3 higher
Matif wheat and corn values are firmer, lending some short-covering activity to corn and wheat at these lows.
Outside markets feature firmer energies at $56.36/barrel, a firmer US dollar at 97.15, and the Dow up 85 pts which seems to be adding some peripheral strength to the market.
TECH TALK
Topping formations are neutral to bearish, and therefore often times provide a reason for the markets to break. Tops are noted for corn, beans, and wheat. With this accomplished, they will not turn into key reversal tops until we close under $4.20 Dec corn, $8.85 Nov beans, and $4.85 Sep wheat. If short, could be covering in partial positions and keeping the rest in case the market confirms that we are trading to the downside of these tops.
- Some are noting that a head and shoulders top is forming in beans, but not sure the criteria is all there for that. Charts seem to have an upside slant with a third shoulder that is too high for November beans. In terms of market behavior, the ability of beans to come back from values under $9.00 is more friendly than not, and the market is rallying this morning on fairly good volume. This could be a combination of short-covering and bottom-picking in the bean market as traders note strength from the $9.00 level.
- Dec soyoil has popped off the 28c lows that gave way yesterday to a round of selling that took the chart to new lows at 2878c.
- Dec meal congests just above its critical support level of $310.00, and this morning's rally from the low of the break puts the chart on track to trade back towards $317.00 which is the midpoint of the constant $310.00-$325.00 trading range.
- Dec corn is a slow mover this morning as traders still appear ready to lighten up on core long positions. However, for the day would think that $4.26-$4.28 holds the line for a regroup push back towards $4.40.
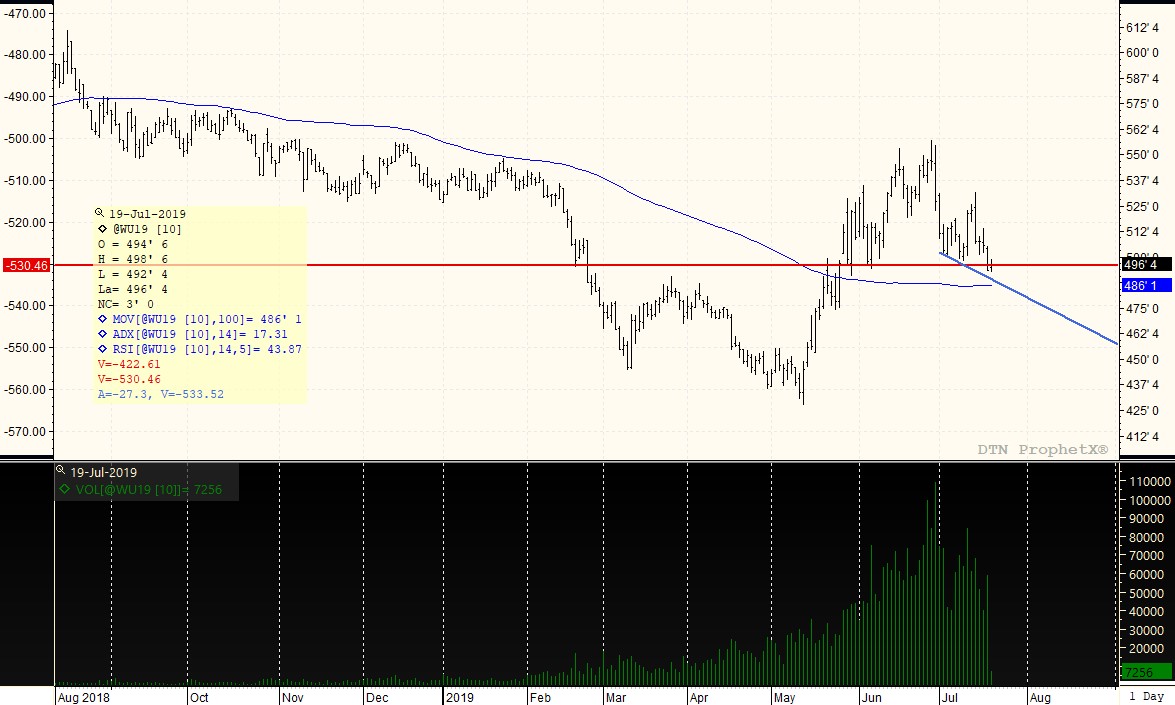
- Sep wheat has the largest negative technical picture, with what appears to be a top in place with trade heading underneath. We have been a $5.00-$5.40 trading range, but still need to confirm a top with a neckline close underneath, which would only be confirmed with a break and close under $4.85. Suggestion is to lighten up on short positions until we close under $4.85.
SEPTEMBER WHEAT
Is this the tip of the iceberg for Sep wheat? This chart presents the closest item to a head and shoulders top in that it has good symmetry on the right and left shoulder with a double peak head. The suggested neckline is horizontal at $4.90, with the 100-day moving average at $486. Therefore, if a close under $4.85 does occur, the path of least resistance would be lower, which would take prices down to $4.75 minimally, and $4.50 under that. We are probing to the downside of this market and today is key, as prices have to turn and now close back over $5.00 to keep a real top formation from occurring.
TAGS – Feed Grains, Soy & Oilseeds, Wheat, North America
 As WPI readers likely well know by now, U.S. gross domestic product (GDP) grew at an inflation- and seasonally-adjusted 1.6 percent rate in Q1 2024, which missed economist’s 2.4 percent expectations. The data sent shockwaves through U.S. financial markets with U.S. stocks and bonds openin...
 Wheat remains the star of the ag commodity space this week with the rally continuing on challenging weather prospects for the U.S. HRW region, Europe, and the Black Sea. Until a few weeks ago, there were few doubts about the 2024 crop being able to supply the expected demand, but now reduced yi...
 Most Apparent Solution The EU’s organic sector wants the bloc’s officials to take more action to ensure they achieve the target of 25 percent of agricultural output being organic by 2030. Specifically, they want a campaign to increase consumer demand for organic food so that organic...