

Key Takeaways:
- The tariff burden rose sharply in 2025 and 2026: the effective rate on imports in HTS Chapters 1–24 increased from 1.53 percent in 2024 to 6.11 percent in 2025, before averaging 5.68 percent in January–August 2026.
- Headline rates tell only part of the story: exemptions, trade preferences, implementation dates, and shifts in suppliers determine the average duties assessed on actual imports.
- Higher costs are clearer than trade-balance gains: research links tariffs to higher U.S. prices, but higher duties alone do not establish that agricultural imports or the trade deficit declined because of them.
How Effective are Tariffs on U.S. Food and Ag Imports?
Last week’s review of the U.S. agricultural trade balance showed its remarkable turn to the negative. The recent decline in U.S. exports and the steady rise in imports of high-value products such as beef and veal, horticultural products, malt beverages, and distilled spirits have driven the trade balance downward to a negative $40 billion.
But weren’t tariffs supposed to fix this for us? The second Trump administration began raising tariffs within weeks of taking office. Since then, increases have been followed by exemptions, negotiated reductions, pauses, and court decisions. Keeping track has become a struggle.
Instead of a deep dive into the many changes in tariff authorities and headline tariff rates, we will use the effective rate: calculated duties divided by the customs value of imports. This provides an estimate of the average tariff burden on actual imports and offers a useful approximation of duties collected. The United States International Trade Commission (USITC) presents this data in this fashion in the USITC DataWeb.
We will also examine tariff rates using HTS Chapters 1–24, which cover food, feed, and other agricultural products. This selection includes fish, and other seafood but excludes forest products. It is therefore broader in some respects than the agricultural trade definition used in USDA’s Foreign Agricultural Trade of the United States (FATUS).
The distinction matters. A headline tariff tells us the rate applying to a specific product. An HTS chapter’s effective rate tells us the average across everything imported under that chapter, including products and suppliers facing lower rates or no duties at all.
What Remains in Place?
As of late October 2026, four tariff authorities are particularly relevant to food and agricultural imports: the July 2026 measures generally imposing 10–12.5 percent on covered goods from 60 economies; the older Section 301 tariffs on China; a separate 25 percent tariff on covered Brazilian goods; and 50 percent duties on selected Canadian goods. Each has exceptions. Some Canadian food and beverage products are now prohibited from entry rather than simply taxed.
These programs operate alongside the regular tariff schedule, including longstanding agricultural duties and tariff-rate quotas. The original April 2025 “Liberation Day” tariffs ended in February 2026, and the temporary global surcharge that followed expired in July. The January–August 2026 figures consequently span several different tariff regimes.
Why the Headline and Effective Rates Differ
There are four principal reasons:
- Timing. Annual and year-to-date averages include imports arriving before and after tariff changes. Some measures also provided temporary exceptions for qualifying goods already in transit. Tariffs generally depend on the date of entry for consumption, not simply when a shipment leaves its foreign port.
- Product exemptions. A widely announced country tariff may exclude substantial categories of food and agricultural products.
- Preferential treatment. Qualifying USMCA imports can enter free of regular duties and are exempt from some additional tariffs. Those preferences do not override every separate tariff action.
- The mix of imports. A chapter combines many products and suppliers. If buyers shift toward lower-duty products or origins, its effective rate can decline even without a change in the tariff schedule.
What the Figures Show
Using this method, we get a comparison of average burdens across different periods, not a reading of the tariff schedule on a single date. In 2024, the combined effective tariff rate for Chapters 1–24 was just 1.53 percent. Rates varied considerably: dairy products faced an effective rate of 6.71 percent, while live animals and edible fruits and nuts were below one percent.
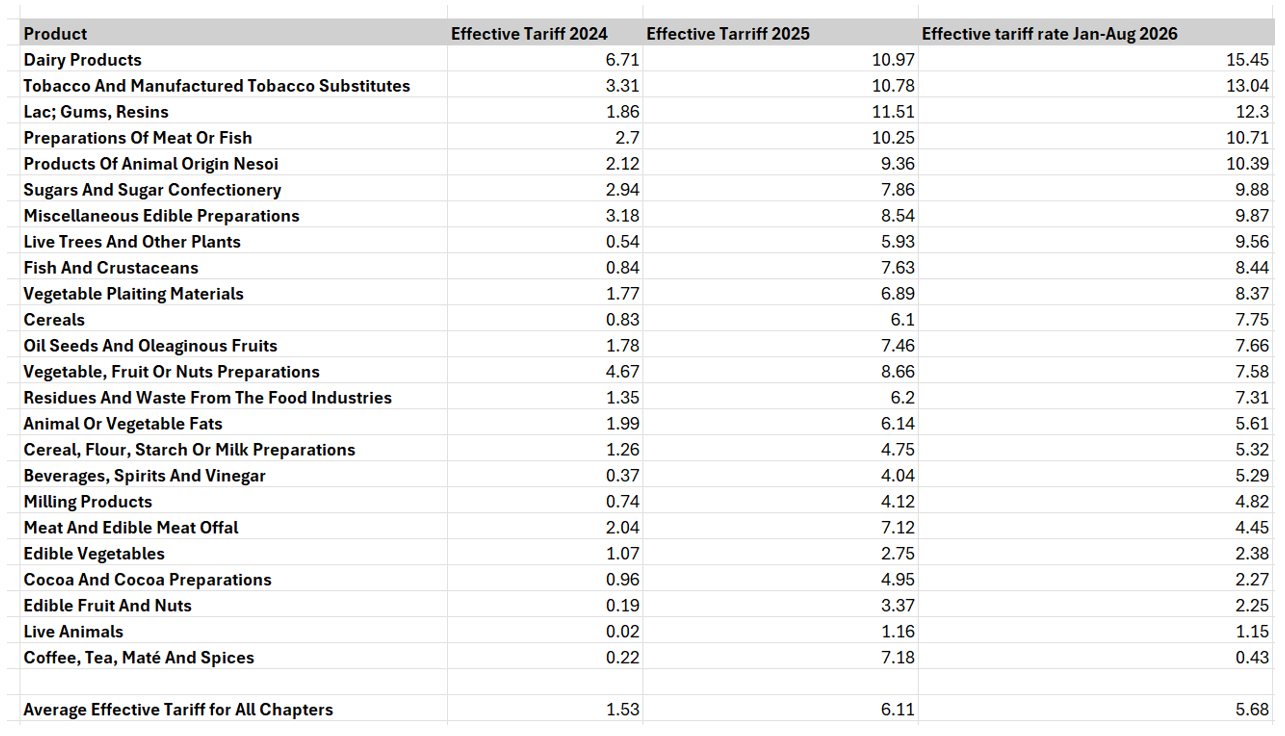
Source: U.S. International Trade Commission DataWeb
In 2025, the combined rate rose to 6.11 percent. Rates increased in all 24 chapters and exceeded 10 percent in four: dairy products; tobacco and manufactured substitutes; lac, gums, and resins; and preparations of meat or fish. Live animals still faced a comparatively low rate, although it increased from 0.02 percent to 1.16 percent.
For January–August 2026, the combined effective rate was 5.68 percent. That was below the full-year 2025 average but still well above 2024. The next question is whether those higher duties changed what Americans bought from abroad—or mainly changed what they paid for it.
Can Tariffs Be Linked to High Food Prices?
Tariffs can raise the cost of imported food directly, increase domestic processors’ input costs, and give competing domestic suppliers more room to raise prices. All three of these forces can combine to raise food prices.
Several studies have determined various levels of pass-through of the tariffs into the general level of prices, while others have focused on tariff exposure to various imported products. Two studies specifically examined food and agricultural products. One was North Dakota State University’s Agricultural Trade Monitor, which evaluated effective tariff rates and found that food imports were much less exposed than headline tariff announcements suggested. The study also reviewed tariff rates and exemptions for agricultural inputs such as seeds and fertilizers.
The Federal Reserve Monetary Policy Report of July 2026 identified tariffs as contributing to the increase in food prices but did not specify a specific amount of that contribution. Other studies were economy-wide and identified some specific pass-through effects of the tariffs on the general level of prices. These included The Slow Climb: How Tariffs Gradually Raised Retail Prices in 2025, another Federal Reserve Board publication, which identified specific impacts on prices by evaluating tariffs and price indices, including the Personal Consumption Expenditure (PCE) Index and the Fisher Price Index.
Tariffs: How to Measure Success?
So, were tariffs supposed to fix this for us? They have certainly raised the cost of bringing food into the United States. The impact on the reversal, or at least a slowdown in the rapid rise of the agricultural trade balance, is harder to find. As we reviewed last week, Americans still want products from abroad, and a tariff here and there does not necessarily change that preference—or create a domestic substitute. We have clearer evidence that tariffs made food imports more expensive, but not that they made those imports less necessary. That would be a much different measure of success.


 What You Need to Know Today: The November Cattle on Feed Report, which details October placements and marketings alongside 1 November on-feed inventories, was notably bullish, with placements falling below even the lowest analyst estimate. President Trump’s meetings with Asian leaders su...
 USDA’s 1 November cattle on feed report was released today, with cattle in feedlots with a capacity of 1,000 head or more totaling 11.6 million head, 99 percent of last year. Placements dropped in October to their lowest total for the month since records began in 1996, setting a record l...

