SPREADS
Dec crush trades higher to 1.11c/bu, which will incentivize crushers to do all they can. Oilshare trades higher to 47.0%. Dec/March corn trades from 7 1/4c to 8 1/4c while Dec 21/22 trades from 13 1/4c down to 11 1/4c. Nov/Jan bean carry trades from 9 1/2c to 10c. Nov 21/22 trades from 13 1/2c to 8 3/4c inverse. Dec wheat/corn trades from 1.88c to 1.96c. Dec/March wheat trades from 10c to 11c carry.
PALM OIL
Dec down 98 ringgits ending at 4,497 ringgit/mt. SGS forecast exports for palm in Sep at 1.705 mmt, up 43% from August of 1.191 mmt. Palm oil exports were 34% higher in Sep vs. month ago, according to data from AmSpec Agri.
NEWS
Stocks are 120 pts higher with crude at $74.23/barrel and the US dollar at 94.03.
CALLS
Calls are as follows:
beans: 2-3 lower
meal: 1.20-1.40 higher
soyoil: 50-60 pts lower
corn: 1 1/2-2 higher
wheat: 10-11 higher
canola: 1.80-2.00 higher
BUSINESS
No business reported.
TECHNICALS
November Beans: Major direction is sideways, but the report resulted in an outside day with a push down to new lows below $12.50. Prices must stay above $12.50 in order to stabilize, but on another break visual trendline support is located at $12.45. Resistance now moves down to $12.80. Stronger corn price action may dictate that for the day $12.50 remains a key support level, but would not be surprised to see this market trending down towards $12.40 in time. The 200-day moving average at $12.78 is now major resistance should we go there.
visual trendline support: $12.45/$12.48
resistance: 12.60/$12.65
possible range: $12.45-$12.65
December Meal: New trading range lows were noted here with a push to $328.00, double lows for now. The market has now moved very far away from this level which must prove it can hold. The previous support from $338.00-$348.00 is now major resistance, but think we can rally back to test it. Target low is $320.00-$325.00 on another break.
first support: $326.00-$328.00
resistance: $331.00 to $332.00
possible range: much the same
December Soyoil: Trading range is from 55c to 60c, and prices continue to pivot around 58c. On further weakness, trendline support is located at 5750c, and if we go there think it holds for an eventual target trade of 60c.
trendline support: 5750c
resistance: 5850c
possible range: much the same
December Corn: The chart is attempting to define a trading range now, which could be from $5.25 - $5.55, or a bit lower from $5.15-$5.45. Look for prices to perhaps move sideways from this point, but the ability to trade back towards $5.40 after breaking hard to $5.27 is impressive.
first support: $5.28/$5.32
resistance: $5.39/$5.42
possible range: $5.35 - $5.42 or lower
December Wheat: The chart has now reinforced support at the $7.00 level which is both where the 100 day moving average and trendline cross. The new high for the move up is $7.39 1/2 and we settled near it, which implies we could see follow-through strength at the open. Would look to probably work into a $7.00-$7.50 range again, a bit higher than before the report yesterday.
first support: $7.28/$7.32
resistance: $7.38-$7.45
possible range: much the same or lower
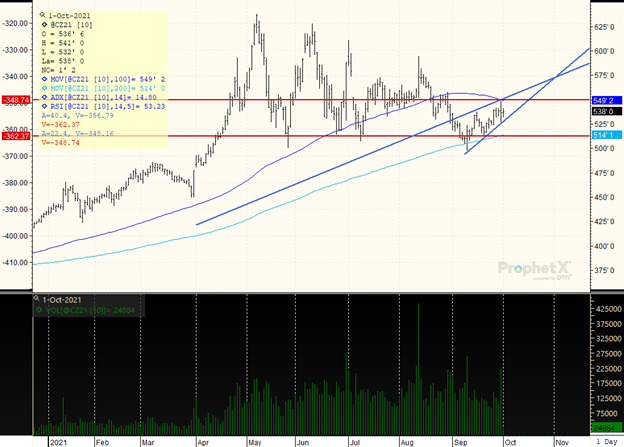
DECEMBER CORN
Trading range, and post report the chart is not as bearish as it could be. The market is walking back to see if $5.25 is the potential bottom of a $5.25 - $5.50 trading range. The ADX is still weak at 14 which is indicative of a sideways range. Pullbacks towards $5.25 down to $5.15 should hold in place. The market would now have to break the bottom of the ascending triangle pictured below which is $5.28, but prices are actually moving up and away which is constructive. Look for a larger trading range to develop, and think firmer corn could keep beans supported at the $12.40-$12.50 level.
TAGS – Feed Grains, North America
 Wheat remains the star of the ag commodity space this week with the rally continuing on challenging weather prospects for the U.S. HRW region, Europe, and the Black Sea. Until a few weeks ago, there were few doubts about the 2024 crop being able to supply the expected demand, but now reduced yi...
 Most Apparent Solution The EU’s organic sector wants the bloc’s officials to take more action to ensure they achieve the target of 25 percent of agricultural output being organic by 2030. Specifically, they want a campaign to increase consumer demand for organic food so that organic...
 Yesterday, the Animal and Plant Health Inspection Service (APHIS) issued a federal order requiring testing and reporting of highly pathogenic avian influenza (HPAI) for the interstate movement of lactating dairy cattle. Specific guidance will be issued at some point today, and the order will go...